|
|
|
Our Site, and supporting structures
The site available to us was fairly open with few tall trees (a dry climate has some advantages) and sloped toward the north at a useful 5°.The only suitably located building available to us had a roof much too small for the required 54 or so panels (each around 0.8m × 1.6m). We thought at first to place the panels on frames on the ground, but were told that the frames would cost something like $10k and that we might be better off to consider building a simple, large shed so that the panels could go on the roof and the space inside would be useful for storage.
We had been thinking of building a pergola for summer shade near the barbeque, so I started looking into designing a suitable pergola that
would also serve as a frame for the photovoltaic panels.
The problem here was that such a pergola would be very big and high as
well; it was difficult to imagine something that could be built for a
reasonable price and look acceptable.
|
What to do? The best answer seemed to be to place half the panels on a smaller pergola and the other half on and near the shack. There was room for 21 on the roof and I could build a veranda for the other six. But politics were to intervene.
Inverters
The power from solar panels is low voltage direct current (DC); it must be converted to higher voltage alternating current (AC) before it can be fed into a 'normal', 240V AC, power supply. This is handled by a black box called an inverter. Surprisingly, two five-kilowatt inverters (or three three-kilowatt inverters) are cheaper than one ten kilowatt inverter. This meant that it is quite economically viable to have two (or three) more-or-less independent smaller solar power systems, rather than one large one.|
|
Requirements for Solar Credits
In order to receive the full Federal Government incentive in Australia, what they call Solar Credits, the solar power system must be on premises which can be a house, church, school, or are associated with your business activity (eg. a dairy in the case of a dairy farm, a shearing shed in the case of a sheep grazing property). I had to use the last alternative, my premises are used for the storage, racking, bottling, labelling, and capping of olive oil from my 600-tree olive orchard; the processes of bottling, labelling and capping were accepted as processes that occurred on my premises involved in running the enterprise.Permission to feed into grid
Depending on where your place is, the local power grid may not be capable of handling the output from a 10 kW 'small embedded generating unit'. I had to contact ETSA (the organisation in SA that runs the poles and wires) and apply to connect. Some rural power supplies are not capable of handling as much as 10 kW of power, especially SWER (single wire earth return) supplies that are a long way from the main power lines. I was fortunate in having installed a two-phase connection and being only 100m from a high-voltage three-phase power line, which itself was within 100m of two branch lines.|
|
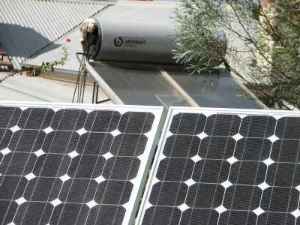
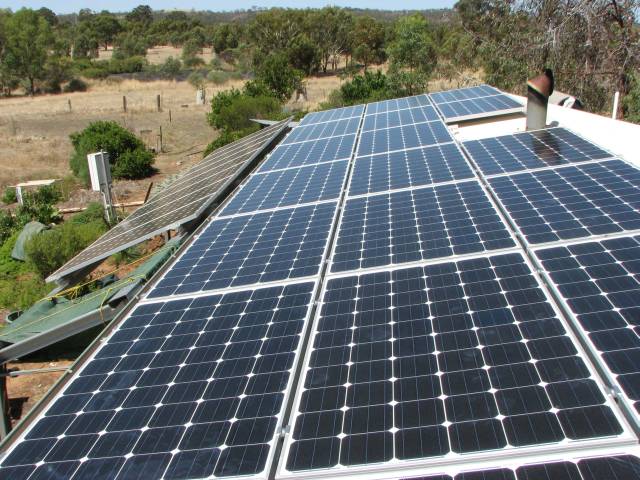
Minimising the operating temperature of the panels
Solar photo voltaic panels produce less electricity as they get hotter; the difference is very significant. (I believe that thin film amorphous silicon panels suffer less from this effect than do crystalline silicon panels.) Therefore it is very important that panels attached to a roof should have a goodly space under the panels and above the roof to allow the free flow of cooling air between roof and panels. My information suggests that at least 80mm should be provided, 150mm would be even better.
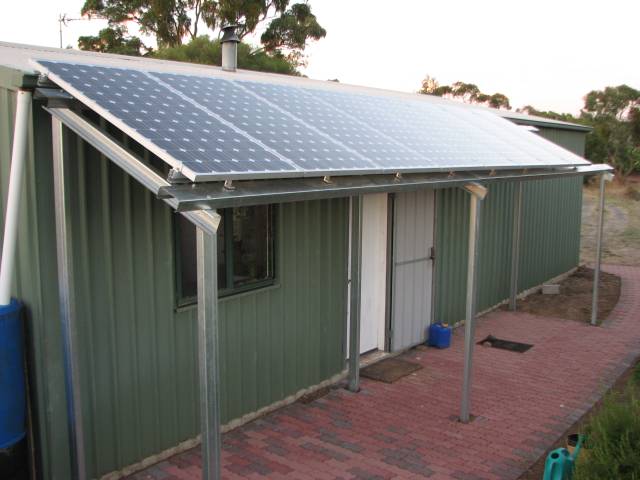
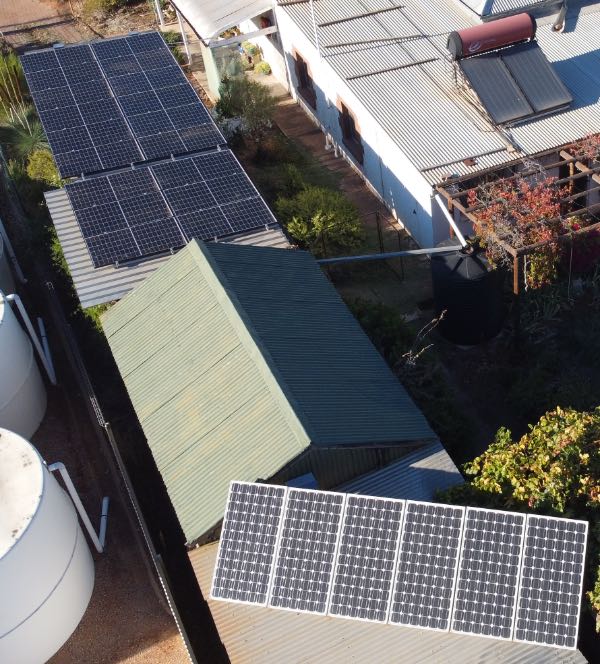
My panels were installed on a free-standing frame, giving more ventilation
than would be achieved on a roof (see
photo).
Solar installers
I chose to use one of two accredited local solar power installers, either Clewers (of Clare) or Luke O'Dea (with connections to Clare, Crystal Brook, and Adelaide).Clewers would use two CMS 5000 (5000W) inverters and 54 × 185W Enertech monocrystalline panels having a total nominal capacity of 9990W. O'Dea would use two Enerdrive GT 5.0 AU (5000W) inverters and 51 × 190W Phono panels having a total nominal capacity of 9690W.
The major hiccough, referred to elsewhere, changed things, but eventually I went with Luke (although I'm sure that Clewers would have done the job very well too).
Quotes, things to think about
One of the initial quotes included trenching, the other did not; but as there was only one trench about 25m long involved I felt I could dig it myself without much difficulty.
|
|
|
Money
I expected the whole thing, before the major hiccough, including building the pergola, to cost about $50k for 10 kW. I use only about 2.5 kWh of electricity per day (about 1.3 kWh during daylight hours). The 10 kW solar power system should generate about 42 kWh per day, of which about 41 kWh will go into the grid each day (about 15 000 kWh per year). The government payment in SA was, at the time I was planning this, 44¢/kWh, electricity retailers pay an about (depending on retailer) an additional 8¢/kWh. Income should be near $8000/yr, paying back the cost of the system in around 7 years and paying about 16% on the money invested. ("The best laid plans of mice and men aft gang aglee.")When figuring how much it is all going to cost you, you should not forget that you will probably need a new electricity meter; ours cost us $652 (our daughter in WA only had to pay $250 for hers).
|
|
WA instead
In the end my wife and I were not able to install our 10kW solar power system, due to the major hiccough discussed elsewhere.Instead we installed a small (1.5 kW, about $3k after Fed. handout) solar power system on our own place on 2011/01/18 and paid for a larger (5.3kW, about $23k) system to be installed on our daughter and son-in-law's house in Western Australia on 2011/01/25. In its first full day of operation, the 26th, this installation generated a promissing 40 kWh.
In return for paying for the WA system we will get half of the money that our kids save on their power bills. (I've estimated that from the present roughly $2100 annual total payment for power they should go to a refund of something like $1500.) The calculated annual return for us is around $1800, or 8% on our investment, the kids should save another $1800 in power bills.
And Adelaide, South Australia
Later we paid for a solar installation, I think it was about 3.4kW, on our son and daughter-in-law's flat in Adelaide.Politics
Before late August 2010 the South Australian Government payed 44¢/kWh for solar power fed into the grid (a 'net payment' system). Following that date they made themselves look good (superficially) by increasing the payment to 54¢/kWh, but at the same time greatly reduced the number of people who could qualify for this, and greatly reduced the maximum size of the solar power system that would qualify.
|
Major hiccough in our plans!
When the government changed the rules for people who want to receive the electricity feed-in tariff to specifically exclude anyone hoping to make a profit and anyone who already has a solar power system, no matter how small, they made my proposed 10 kW system unviable.Inquiries with the Dept. of The Premier confirmed that our system will not be eligible. So, instead of installing a 10 kW solar power system on my own place I'm arranging to pay for a 5 kW solar power system on my daughter's place in WA and have a 1.5 kW system put on my own place.
We will not get the 54¢/kWh feed-in tariff for our little 1.5 kW system any more than we would for our originally proposed 10 kW system, but we should still get about 8¢/kWh from the electricity retailer, and feel that we are doing a bit for the planet. We were advised not to put anything as large as a 10 kW system up in WA because of the perceived probability that the WA Government were intending to change the rules similarly to SA.
|
|
Finally! Up and running
|
We also had to pay $652 for the new (3 phase) electricity meter (a single phase meter is cheaper, about $400). Our daughter in WA had to pay only $250 for her new 3 phase solar meter. I have asked ETSA why the difference, and written a letter to several newspapers posing the same question.
The 1.5 kW system should generate about 2300 kWh per year. This was a much smaller system than the 10 kW that my wife and I were originally planning but at least it was an investment toward reducing our greenhouse footprint and it was not a huge financial burden.
There were several reasons for placing the panels on the frame on the northern side of our shack rather than on the roof.
- The roof had a slope of only 11°, not sufficient for optimal solar power generation at our latitude; the frame gave a slope of 26° to the panels;
- The shade from the panels would keep the hot summer sun off our northern wall and passively keep our temperatures down;
- The panels would be able to get the maximum cooling ventilation, minimising the operating temperature and maximising their efficiency.
When the photo was taken (2011/01/21) everything but the inverter was in place, the panels were installed on the 18th. I had to wait until 2011/02/02 for the inverter to arrive and be installed; the new meter (capable of measuring feed-in as well as consumption) was installed the next day.
|
|
Performance
|
|
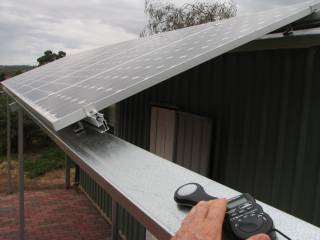
As one would expect, there is a linear relationship between light intensity and power output; with an increase of about 11W for each thousand Lux.
The power output of silicon solar panels, especially crystalline panels like ours, decreases with increasing temperature, and an analysis that I did on 2011/02/15 indicates that the output of our system decreases by 4.7 Watts for each one degree increase in temperature.
By 2011/02/22 we were averaging 6.8kWh/day at the inverter, significantly
less than the installer's forecast (see box on the right).
The short-fall would probably be due to there being a lot of cloud cover
for the time of year.
The maximum power that I had recorded to then was 1326 Watts.
|
|
|
|
|
This is roughly what the power output of our system would look like if the
panel temperature could be held to 23°C.
|
It is pleasing that we are exporting three or four times as much power as we are importing; a good result considering we only have a 1.52kW system. It was less pleasing that our system generated an average of 7.04kWh/day in February; the installer's figures indicated 8.7 as the expected average for February. (It generated 5.99kWh/day in March, against the stated 7.7.) But there was probably more cloud in this February and March than average, time will tell if it is as good as it should be.
Our average electricity consumption before installation of the solar system was 2.24kWh/day.
|
|
The WA installation compared to Clare
As mentioned elsewhere, the solar power system that we had installed at Clare was rated at 1520W and the one installed on our daughter's house at Mandurah in WA was rated at 5280W. Our unit has eight 190W mono-crystaline Phono panels, a 1.5kW SMA Sony Boy inverter and was installed by O'Dea Electrical on 2011/02/02. Our daughter's unit has 48 Kaneka 110W hybrid panels, a Xantrex GT5.0-AU inverter and was installed by The Solar Shop, Mandurah on 2011/01/25.
To 2011/02/17 the greatest output I have recorded from our unit is 1326W,
that is, 87% of its rated capacity.
My son-in-law recorded an output of 5079W, 96% of the rated capacity of
the Mandurah system.
You'd have to say that, on this measure, the Solar Shop installation is at
present looking better than the O'Dea installation.
Our solar power at Crystal Brook
| ||||
| ||||
The graph at the right shows a record of data from our electricity meter. The blue line records that amount of electricty that we have taken from the grid on our main circuit. Our power consumption is greatest in summer due to two things: the refrigerator and freezer have to work harder to maintain their set temperatures, and we use a ducted evaporative air conditioner for cooling the house. The pink line shows the amount that has come from the grid at off-peak times for the electric booster of our solar water heater. The yellow line shows that amount that has been fed into the grid from our solar panels.
Power from the solar panels is fed into the grid only when its amount is
greater than the power that we are consuming in the house.
Out with the old, in with the new at Crystal Brook
On 2021/03/01 we had our old 1kW solar system replaced with a new much bigger system.At 4pm (central daylight savings time) the day before I measured the output of the old solar system as 1.9A at 245V, so 466W. The sun was on an angle of perhaps 45 degrees to the panels at the time.
The old system had worked well. There was a failure at one time, but it was fixed at little expense. Considering that the old system was over 15 years old and still operating when it was superseded this seems quite good.
|
|
Summary of meter reading from the old system
The figures below are averages in kilowatt-hours per day
Period | Main circuit | 'J' circuit | Feed-in
|
|---|---|---|---|
2006-August 2017 | 4.97 | 0.56 | 1.84
|
August 2017-April 2021 | 4.91 | 0.41 | 1.61
|
The 'main circuit' is power imported from the grid
The 'J' circuit is power imported for water heating overnight (we have a solar water heater so we only need electricity to heat the water in overcast wintery weather).
The 'Feed-in' circuit is power exported to the grid.
The power meter was changed in August 2017 and again in April 2021.
I've written a section about the new installation below.
Effect of replacing the old freezer
We bought a new, more efficient, freezer on 2010/06/30; previous to this we had a freezer that was more than 30 years old. This significantly reduced our electricity consumption and increased the amount our solar system was able to feed into the grid.Our average power consumption on the main circuit for the two years before this was 7.02 kWh/day and dropped to 4.38 kWh/day for the period 2010/06/30 to 2011/01/16 (a decrease of 38%). The average amount of power that we fed back into the grid in the two years before the new freezer was 1.39 kWh/day and this increased to 1.96 kWh/day from 2010/06/30 to 2011/01/16 (an increase of 41%).
I have calculated that the $1100 new freezer will pay for itself in
four years due to the lower power consumption and the greater payments
for the power that we put into the grid.
|
|
|
More solar at Crystal Brook
| ||||
|
It will be interesting to see how it goes.
Our first 1kW system at Crystal Brook had no information available from the inverter at all. I could measure the current output and I could read how much power from the system was being fed into the power grid on our electricity metre. I could not measure how much power from the solar system we were consuming at home.
On 2021/04/06 a man came to install a new meter so that our new panels could export power to the NEM (national electricity market). The SMA inverter apparently was transmitting data (the meter installing electrician said so), but I was unable to get any sign of operation from the SMA app that I installed on my iPhone at the time the panels were installed. The power meter indicated that power was being exported.
The SMA inverter in the new system is supposed to connect to my iPhone through either an app or via a QR code and provide current output as well as a record of solar generation. Sometimes the QR code system works, most times it does not. The app system doesn't work at all. I still have to rely on the meter in my home meter box to check that the new solar system is working.
I called the installer for help and they dropped in twice to try to sort out the problem but as of late May 2021 I was still rarely able to communicate with the SMA inverter. SMA's system is very poorly arranged.
|
|
Another 5.2kW
|
The angle is not optimal, being only about 14°, although it does face almost directly north.
This job was done by O'Dea again.
So as of 2014/02/18, my wife and I have paid for the installation of:
- 2006/02/08; 1kW of panels on our house at Crystal Brook
- 2011/01/24; About 5.3kW on our daughter's house in Mandurah
- 2011/02/02; 1.52kW on our shack at Clare
- 2011/06/29; About 3.4kW on our son's house in Adelaide
- 2014/02/18; Another 5.2kW on our shack at Clare
|
|
|
Total solar installations
With the second installation at Crystal Brook the list of all the installations my wife, Denece, and I have paid for as of 2014/02/18 is:- 2006/02/08; 1kW of panels on our house at Crystal Brook
- 2011/01/24; About 5.3kW on our daughter's house in Mandurah
- 2011/02/02; 1.52kW on our shack at Clare
- 2011/06/29; About 3.4kW on our son's house in Adelaide
- 2014/02/18; Another 5.2kW on our shack at Clare
- 2021/03/01; Another 5.94kW on our carport at Crystal Brook
|
|
|
A move to Western Australia
Due to declining health and feeling that we wanted to minimise driving long distances my wife and I moved to Western Australia in 2022. Public transport in both Clare and Crystal Brook was minimal; there were good public transport options in Mandurah, WA. Together with our daughter and her family we bought a house big enough for the six of us.The house had what must be about 3kW of solar power. As we had ample roof space I considered adding another 5kW or so. On inquiries I found that if I wanted to increase the size of our solar power system I would have to either remove the existing system or forego a $3000 government subsidy on a new solar power system.
To the present I have not made any changes to the solar power on our shared house. (We did replace a gas water heater with a heat pump water heater.)